Thermodynamics Chat Support Connect to Thermodynamics
Message to Thermodynamics

Request a Quote

Dubai
+971 ▾
  • Afghanistan +93
  • Åland Islands +358
  • Albania +355
  • Algeria +213
  • American Samoa +1
  • Andorra +376
  • Angola +244
  • Anguilla +1
  • Antigua and Barbuda +1
  • Argentina +54
  • Armenia +374
  • Aruba +297
  • Australia +61
  • Austria +43
  • Azerbaijan +994
  • Bahamas +1
  • Bahrain +973
  • Bangladesh +880
  • Barbados +1
  • Belarus +375
  • Belgium +32
  • Belize +501
  • Benin +229
  • Bermuda +1
  • Bhutan +975
  • Bolivia +591
  • Bosnia and Herzegovina +387
  • Botswana +267
  • Brazil +55
  • British Indian Ocean Territory +246
  • British Virgin Islands +1
  • Brunei +673
  • Bulgaria +359
  • Burkina Faso +226
  • Burundi +257
  • Cambodia +855
  • Cameroon +237
  • Canada +1
  • Cape Verde +238
  • Caribbean Netherlands +599
  • Cayman Islands +1
  • Central African Republic +236
  • Chad +235
  • Chile +56
  • China +86
  • Christmas Island +61
  • Cocos (Keeling) Islands +61
  • Colombia +57
  • Comoros +269
  • Congo +243
  • Congo +242
  • Cook Islands +682
  • Costa Rica +506
  • Côte d’Ivoire +225
  • Croatia +385
  • Cuba +53
  • Cyprus +357
  • Czech Republic +420
  • Denmark +45
  • Djibouti +253
  • Dominica +1
  • Dominican Republic +1
  • Ecuador +593
  • Egypt +20
  • El Salvador +503
  • Equatorial Guinea +240
  • Eritrea +291
  • Estonia +372
  • Ethiopia +251
  • Falkland Islands +500
  • Faroe Islands +298
  • Fiji +679
  • France +33
  • French Guiana +594
  • French Polynesia +689
  • Gabon +241
  • Gambia +220
  • Georgia +995
  • Germany +49
  • Ghana +233
  • Gibraltar +350
  • Greece +30
  • Greenland +299
  • Grenada +1
  • Guam +1
  • Guatemala +502
  • Guernsey +44
  • Guinea +224
  • Guinea-Bissau +245
  • Guyana +592
  • Haiti +509
  • Honduras +504
  • Hong Kong +852
  • Hungary +36
  • Iceland +354
  • India +91
  • Indonesia +62
  • Iran +98
  • Iraq +964
  • Ireland +353
  • Isle of Man +44
  • Israel +972
  • Jamaica +1
  • Japan +81
  • Jersey +44
  • Jordan +962
  • Kazakhstan +7
  • Kenya +254
  • Kiribati +686
  • Kosovo +383
  • Kuwait +965
  • Kyrgyzstan +996
  • Laos +856
  • Latvia +371
  • Lebanon +961
  • Lesotho +266
  • Liberia +231
  • Libya +218
  • Liechtenstein +423
  • Lithuania +370
  • Luxembourg +352
  • Macau +853
  • Macedonia (FYROM) +389
  • Madagascar +261
  • Malawi +265
  • Malaysia +60
  • Maldives +960
  • Mali +223
  • Malta +356
  • Marshall Islands +692
  • Martinique +596
  • Mauritania +222
  • Mauritius +230
  • Mayotte +262
  • Mexico +52
  • Micronesia +691
  • Moldova +373
  • Monaco +377
  • Mongolia +976
  • Montenegro +382
  • Montserrat +1
  • Mozambique +258
  • Myanmar (Burma) +95
  • Namibia +264
  • Nauru +674
  • Nepal +977
  • Netherlands +31
  • New Caledonia +687
  • New Zealand +64
  • Nicaragua +505
  • Niger +227
  • Nigeria +234
  • Niue +683
  • Norfolk Island +672
  • North Korea +850
  • Northern Mariana Islands +1
  • Oman +968
  • Pakistan +92
  • Palau +680
  • Palestine +970
  • Panama +507
  • Papua New Guinea +675
  • Paraguay +595
  • Peru +51
  • Philippines +63
  • Poland +48
  • Portugal +351
  • Puerto Rico +1
  • Qatar +974
  • Romania +40
  • Rwanda +250
  • Saint Barthélemy +590
  • Saint Helena +290
  • Saint Kitts and Nevis +1
  • Saint Lucia +1
  • Saint Martin +590
  • Saint Pierre and Miquelon +508
  • Saint Vincent and the Grenadines +1
  • Samoa +685
  • San Marino +378
  • São Tomé and Príncipe +239
  • Saudi Arabia +966
  • Senegal +221
  • Serbia +381
  • Seychelles +248
  • Sierra Leone +232
  • Singapore +65
  • Sint Maarten +1
  • Slovakia +421
  • Slovenia +386
  • Solomon Islands +677
  • Somalia +252
  • South Africa +27
  • South Korea +82
  • South Sudan +211
  • Spain +34
  • Sri Lanka +94
  • Sudan +249
  • Suriname +597
  • Svalbard and Jan Mayen +47
  • Swaziland +268
  • Sweden +46
  • Switzerland +41
  • Syria +963
  • Taiwan +886
  • Tajikistan +992
  • Tanzania +255
  • Thailand +66
  • Timor-Leste +670
  • Togo +228
  • Tokelau +690
  • Tonga +676
  • Trinidad and Tobago +1
  • Tunisia +216
  • Turkey +90
  • Turkmenistan +993
  • Turks and Caicos Islands +1
  • Tuvalu +688
  • U.S. Virgin Islands +1
  • Uganda +256
  • Ukraine +380
  • United Arab Emirates +971
  • United Kingdom +44
  • United States +1
  • Uruguay +598
  • Uzbekistan +998
  • Vanuatu +678
  • Vatican City +39
  • Venezuela +58
  • Vietnam +84
  • Wallis and Futuna +681
  • Western Sahara +212
  • Yemen +967
  • Zambia +260
  • Zimbabwe +263
Call for our Solutions
Email Us
Explore our solutions
Select Product
Ice Cream and Frozen Dairy Refrigeration

Ice Cream & Frozen Dairy Refrigeration Solutions

Industrial-scale cooling systems for ice cream production, hardening, storage, and distribution—engineered for product quality, energy efficiency, and cold chain integrity across Middle Eastern markets.

°C+
Temperature Control in Extreme Climates
°C
Milk Must Be Cooled Fast
–
%
Rising Energy Costs & Carbon Footprint
$
–
K/hr
Equipment Downtime & Maintenance

Why Frozen Dairy Refrigeration
Is Different

Ice cream production requires precise control across multiple low-temperature stages — from mix cooling through hardening, storage and last-mile distribution — each with different tolerances and failure risks.

06
Critical Challenges
01

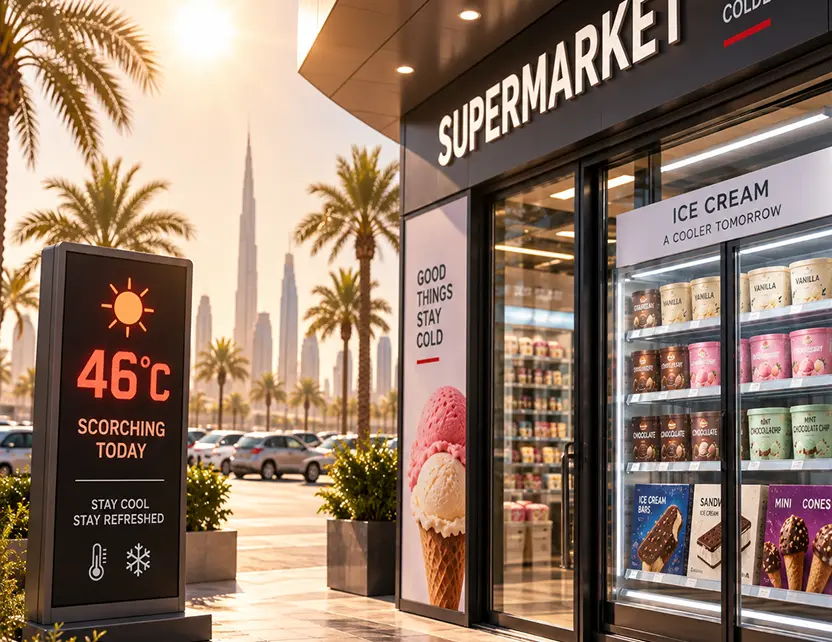
Extreme Ambient Temperatures

GCC ambient temperatures reaching 50°C increase refrigeration energy consumption by 60–70% compared to temperate-climate design conditions, while the cold chain must still sustain ultra-low targets end to end.

Mix cooling 4°C → −1°C
Freezing −5°C → −8°C
Hardening −30°C → −40°C
Storage −25°C → −30°C
Retail −18°C → −22°C
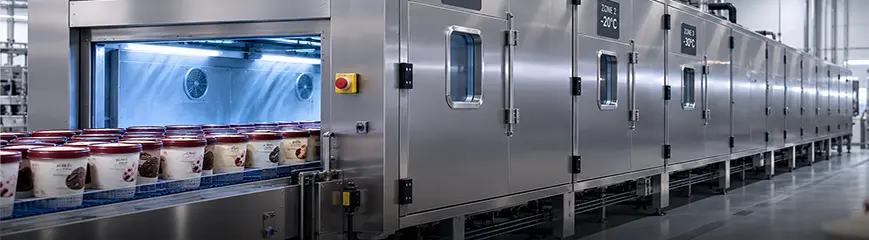
Frozen dairy refrigeration
02

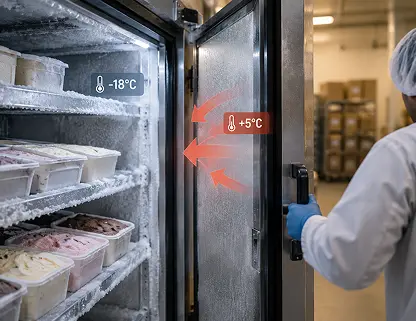
Temperature Fluctuations

Door openings, defrost cycles and load changes create fluctuations that accelerate ice-crystal growth. Each excursion above the hardening curve compounds heat shock and coarsens texture.

Crystal growth accelerates above −18°C
Repeated temperature cycling
Heat gain from door openings
Defrost temperature spikes
Variable refrigeration loads
Temperature fluctuations
03

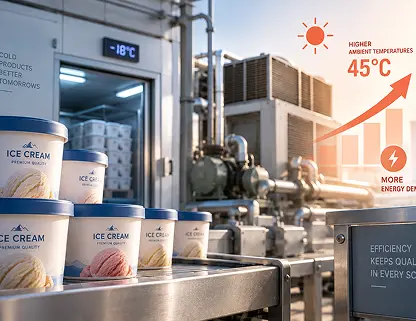
High Energy Demand

Hardening and ultra-low storage are the most energy-intensive stages in the plant. Compressor efficiency drops as condensing temperatures rise, increasing power consumption during hot ambient conditions.

COP falls as ambient rises
Hardening drives peak energy demand
Ultra-low storage increases power use
Compressor load rises in hot conditions
Longer runtimes increase operating costs
High energy refrigeration demand
04

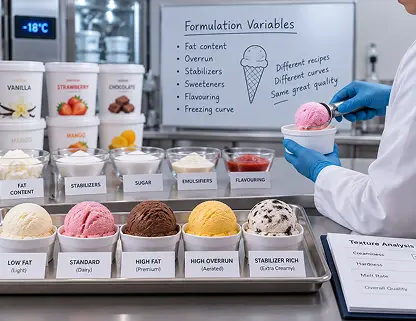
Product Formulation Variations

Fat content, overrun and stabilizer systems shift the freezing and hardening curve. Different formulations require precise temperature control to maintain consistent texture, structure, and product quality.

Fat content shifts freezing point
Overrun affects hardening time
Stabilizers alter ice crystal growth
Different recipes need different curves
Sensitive formulations need tighter control
Ice cream product formulation
05

Quality & Hygiene Control

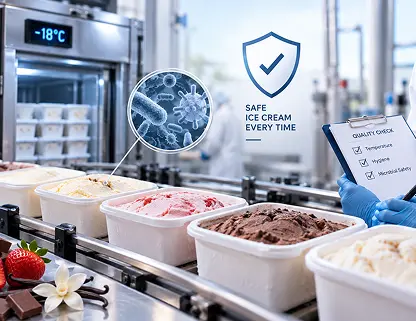
Microbiological control points are closely tied to temperature management. HACCP-based controls help maintain safe processing, prevent microbial growth, and protect product quality throughout production and storage.

Total plate count monitoring
Coliform level control
E. coli contamination prevention
Salmonella spp. growth control
Listeria monocytogenes prevention
Frozen dairy hygiene control
06

Distribution Temperature Abuse

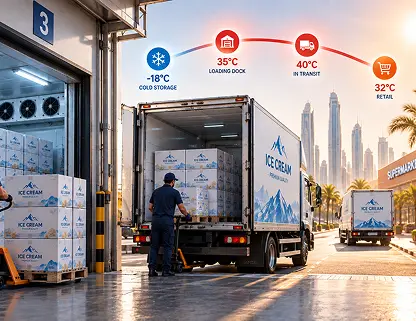
Loading docks, last-mile delivery and retail handling in GCC conditions are common points of cold-chain failure. Repeated exposure to heat can cause temperature excursions and compromise frozen product quality.

Loading dock heat exposure
Last-mile delivery delays
Retail handling temperature swings
Frequent cold-chain breaks
Repeated heat-shock events
Frozen dairy distribution

GCC ambient temperatures reaching 50°C increase refrigeration energy consumption by 60–70% compared to temperature-climate design conditions, while the cold chain must still sustain ultra-low targets end to end.

Mix cooling
4°C → −1°C
Freezing
−5°C → −8°C
Hardening
−30°C → −40°C
Storage
−25°C → −30°C
Retail
−18°C → −22°C
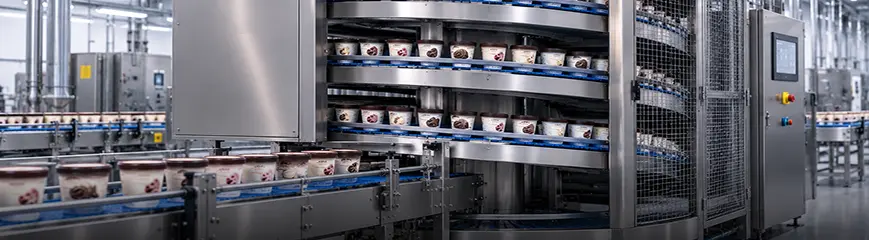
Frozen dairy refrigeration

Door openings, defrost cycles and load changes create fluctuations that accelerate ice-crystal growth. Each excursion above the hardening curve compounds heat shock and coarsens texture.

Crystal growth accelerates above −18°C
Repeated temperature cycling
Heat gain from door openings
Defrost temperature spikes
Variable refrigeration loads
Temperature fluctuations

Hardening and ultra-low storage are the most energy-intensive stages in the plant. Compressor efficiency drops as condensing temperatures rise, increasing power consumption during hot ambient conditions.

COP falls as ambient rises
Hardening drives peak energy demand
Ultra-low storage increases power use
Compressor load rises in hot conditions
Longer runtimes increase operating costs
High energy refrigeration demand

Fat content, overrun and stabilizer systems shift the freezing and hardening curve. Different formulations require precise temperature control to maintain consistent texture, structure, and product quality.

Fat content shifts freezing point
Overrun affects hardening time
Stabilizers alter ice-crystal growth
Different recipes need different curves
Sensitive formulations need tighter control
Ice cream product formulation

Microbiological control points are closely tied to temperature management. HACCP-based controls help maintain safe processing, prevent microbial growth, and protect product quality throughout production and storage.

Total plate count monitoring
Coliform level control
E. coli contamination prevention
Salmonella spp. growth control
Listeria monocytogenes prevention
Frozen dairy hygiene control

Loading docks, last-mile delivery and retail handling in GCC conditions are common points of cold-chain failure. Repeated exposure to heat can cause temperature excursions and compromise frozen product quality.

Loading dock heat exposure
Last-mile delivery delays
Retail handling temperature swings
Frequent cold-chain breaks
Repeated heat-shock events
Frozen dairy distribution

One Cold Chain, Multiple Critical Temperatures.

Six stages, each with its own thermal target. A failure at any single point compromises everything downstream.

Ice cream processing equipment

One Cold Chain, Multiple
Critical Temperatures.

Six stages, each with its own thermal target. A failure at any single point compromises everything downstream.

4°C

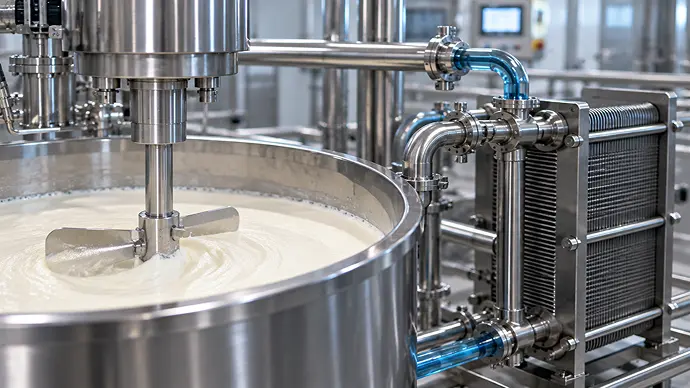
Raw mix is rapidly cooled after pasteurization to halt bacterial growth and prepare for aging.

Ice cream processing equipment
Temperature Range 60°C  →  4°C
Load 60 – 80 kWh
Duration 4 – 6 hours
−5°C

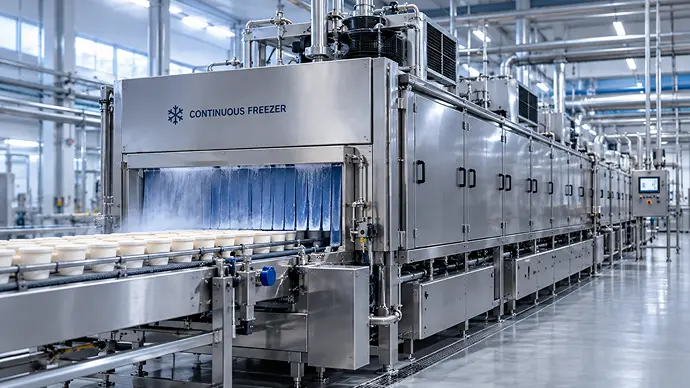
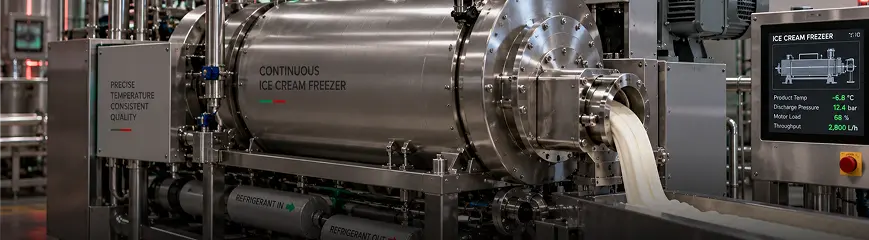
Continuous freezing reduces the temperature of the aged mix while controlling ice crystal formation and maintaining product consistency.

Continuous freezing
Temperature Range 4°C  →  −5/−8°C
Aging Tank 2 – 6 hours
Energy 120 – 160 kWh
−30°C

Rapid hardening freezes the product core quickly, creating the desired structure while limiting ice-crystal growth.

Product hardening
Temperature Range −6°C  →  −25°C core
Duration 20 – 40 min
Energy 150 – 200 kWh
−30°C

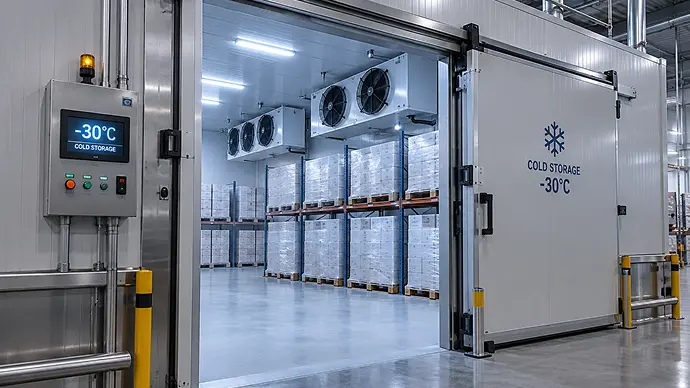
Finished products remain in controlled cold storage to preserve texture, stability and quality until dispatch.

Cold storage
Temperature Range −25°C  →  −35°C
Duration 20 – 40 min
Energy 40 – 60 kWh
−20°C

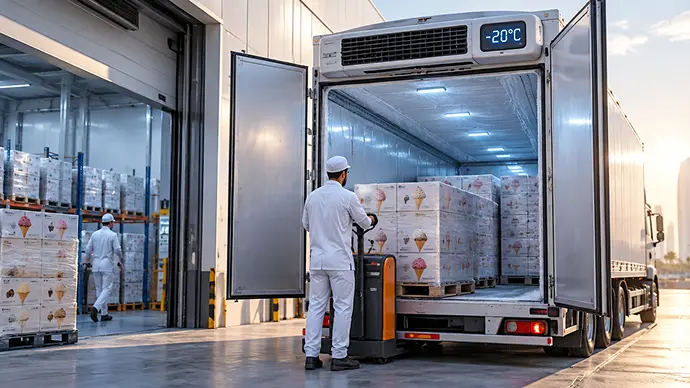
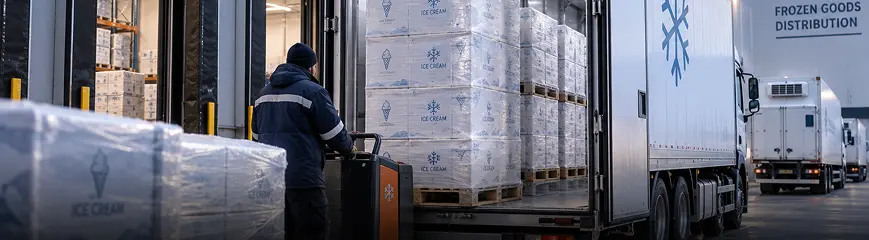
Temperature-controlled distribution protects the product during loading, transportation and delivery, preventing heat shock and quality loss.

Cold chain distribution
Temperature Range ≤ −20°C
Transit 2 – 8 hours
Energy 25 – 40 kWh
−20°C

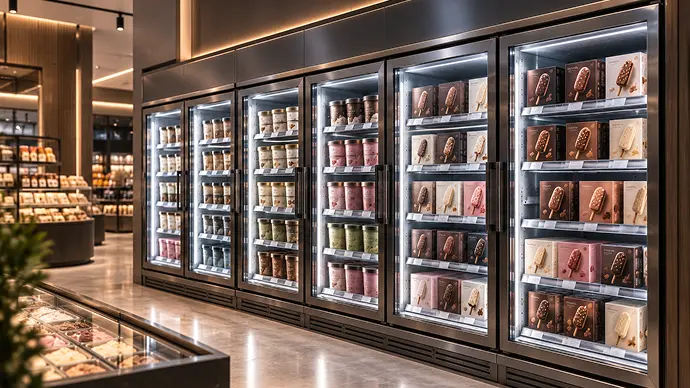
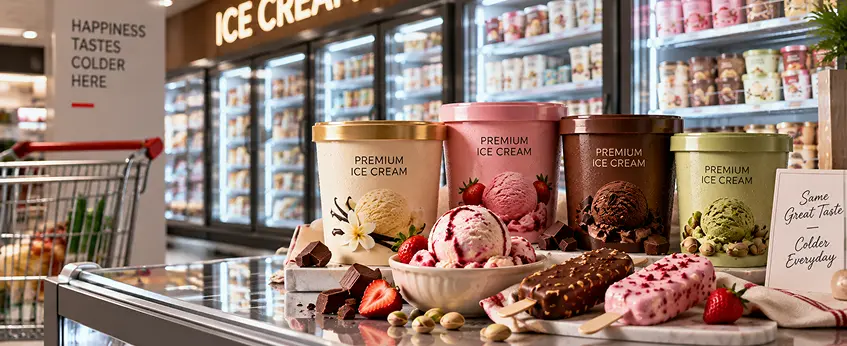
Retail freezers must maintain stable temperatures through storage and customer handling to preserve the final product quality.

Retail freezer
Temperature Range −18°C  →  −22°C
Display −18°C to −22°C
Monitoring Continuous

Engineered Around Your Production Load

Select a facility size to see estimated refrigeration load.

Estimated Facility Load

0 – 0 kW

Get Facility Load Assessment

Temperature Control Protects
More Than the Product

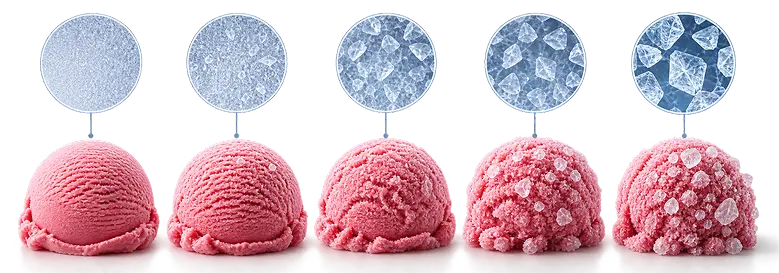
Every fluctuation above the ideal hardening curve allows ice crystals to grow, coarsening texture and shortening shelf life.

<40 μm Ideal crystal size
Ice Crystal Growth Visualization
-30°C
-25°C
-20°C
-18°C
-15°C
-12°C
Smooth Slightly Coarse Icy Unacceptable
<40 μm Smooth, creamy
40 – 60 μm Slightly coarse
60 – 80 μm Noticeably icy
>80 μm Unacceptable quality
>100 μm Product rejection likely

Heat Shock Impact on Crystal Growth

Repeated partial thawing and refreezing compounds crystal growth well beyond a single temperature excursion.

Heat   Shock
1–3 Shocks

Early Crystal Growth

Crystal growth increases by 20–40%

Heat Shock Events

Repeated partial thawing + refreezing

→ Increased ice crystal growth → Progressive quality degradation

Why It Matters

Repeated temperature excursions compound crystal growth beyond the effect of a single temperature excursion.

Typical GCC distribution chain: 3–8 heat shock events between production and point of sale.

Shelf Life vs. Storage Temperature

Storage temperature is the single largest determinant of usable shelf life.

-30°C
18–24 months
-25°C
12–18 months
-20°C
9–12 months
-18°C
6–9 months
-15°C
3–4 months
-12°C
4–8 weeks
-10°C
2–4 weeks
Quality Window
Optimal -25°C to -30°C 12–24 months
Standard -18°C to -20°C 6–12 months
Higher Temperature -10°C to -15°C 2 weeks–4 months
Lower storage temperatures provide longer usable shelf life.

Storage Temperature Matters

Temperature fluctuations above the ideal storage condition accelerate quality deterioration and shorten usable shelf life.

Complete Refrigeration Solutions for Frozen Dairy

Six system categories, engineered together as one continuous cold chain rather than sold as isolated equipment.

Continuous Ice Cream Freezers

CONTINUOUS ICE CREAM FREEZERS

Best For High-volume
production
Capacity 500–5,000
L/hour
Temperature -5°C to -8°C
  • Precision overrun control
  • Rapid, uniform crystallization
  • Hygienic barrel design for continuous multi-shift operation

Specifications

Scraped-surface freezing barrel with dasher-driven mix agitation, ammonia or glycol refrigerant loop, in-line overrun metering.

Best For 120–180 kWh typical draw
Investment Range Scales with L/hour capacity
Quality Outcome Consistent overrun and fine initial ice structure
View System

Complete Refrigeration Solutions for
Frozen Dairy

Six system categories, engineered together as one continuous cold chain rather than sold as isolated equipment.

Continuous ice cream freezer
Best For High-volume
production
Capacity 500–5,000 L/
hour
Temperature -5°C to -8°C
  • Precision overrun control
  • Rapid, uniform crystallization
  • Hygienic barrel design for continuous multi-shift operation

Specifications

Scraped-surface freezing barrel with dasher-driven mix agitation, ammonia or glycol refrigerant loop, in-line overrun metering.

Best For 120 – 180 kWh typical draw
Investment Range Scales with L/hour capacity
Quality Outcome Consistent overrun and fine initial ice structure
View System
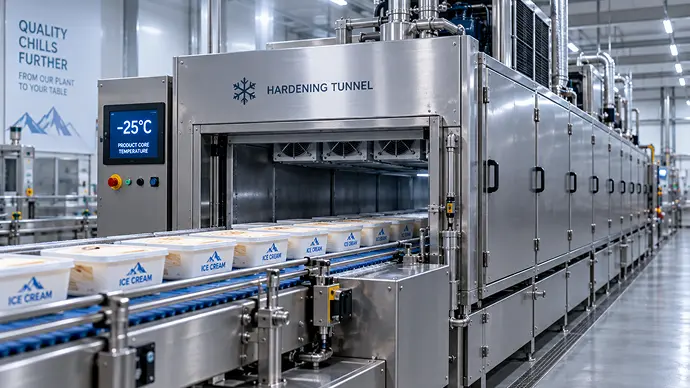
Multi-zone hardening tunnel
Best For High-volume
production
Capacity 1,000–4,000
kg/hour
Temperature -25°C to -40°C
  • Multi-zone temperature control
  • Rapid core hardening
  • Consistent product structure across high-throughput production

Specifications

Modular hardening tunnel with independently controlled temperature zones, high-velocity air circulation and insulated conveyor system.

Best For 120 – 180 kWh typical draw
Investment Range Scales with tunnel length
Quality Outcome Uniform core temperature and stable final structure
View System
Spiral hardening system
Best For Space-efficient
production
Capacity 600–2,500
kg/hour
Temperature -25°C to -40°C
  • Compact vertical footprint
  • Extended controlled residence time
  • Consistent hardening across multiple product formats

Specifications

Continuous spiral conveyor with controlled airflow, insulated enclosure and programmable temperature zones for extended hardening.

Best For High-throughput lines
Investment Range Scales with belt length
Quality Outcome Even hardening and controlled ice-crystal development
View System
Ultra-low temperature storage
Best For Long-term
frozen storage
Capacity 500–5,000
pallet positions
Temperature -25°C to -35°C
  • Stable ultra-low temperature control
  • High-density storage capability
  • Reduced temperature variation throughout the storage environment

Specifications

Insulated cold storage chambers with high-efficiency refrigeration, automated monitoring and controlled air circulation.

Best For Frozen inventory
Investment Range Scales with storage volume
Quality Outcome Stable product temperature and preserved texture
View System
Soft serve and batch freezers
Best For Flexible
production
Capacity 50–500 L/
hour
Temperature -5°C to -8°C
  • Flexible batch and soft-serve production
  • Precise texture and overrun control
  • Fast changeover between formulations

Specifications

Compact freezing systems designed for controlled batch production and soft-serve applications with adjustable freezing parameters.

Best For Specialty and flexible production
Investment Range Scales with production capacity
Quality Outcome Controlled texture and consistent product finish
View System
Distribution refrigeration
Best For Cold-chain
distribution
Capacity 5–40
tonnes/day
Temperature ≤ -20°C
  • Stable temperatures during loading and transit
  • Reduced cold-chain temperature excursions
  • Reliable refrigeration for last-mile delivery

Specifications

Temperature-controlled distribution systems combining insulated loading areas, refrigerated vehicles and continuous cold-chain monitoring.

Best For Regional distribution
Investment Range Scales with fleet and route requirements
Quality Outcome Protected product temperature from plant to retail
View System

The Right Temperature for Every Frozen Dairy Product

Premium Ice Cream

Premium Ice Cream

High-fat, high-overrun formulations requiring the tightest hardening curve to protect a smooth mouthfeel.

View Solutions
Freezing -5°C to -6°C
Hardening -25°C to -30°C
Storage -25°C to -30°C
Transport -20°C to -25°C
Retail -18°C to -22°C

What matters most for your facility?

Recommended system Continuous Ice Cream Freezers

Built for Quality, Compliance & Traceability

Cold-chain records and standards documentation built into every installation.

FDA 21 CFR Part 135
Codex Alimentarius
EU Food Information Requirements
GCC / GSO Standards
Microbiological Standards

Temperature Monitoring Dashboard / Sensor Map

-6°C Production
-35°C Hardening
-30°C Storage
-20°C Transport
-18°C Retail

Traceability & Documentation

Batch Records
Calibration Certificates
Validation Studies
Corrective Action Records
Distribution Records
Audit Trails

Lower Refrigeration Energy Without Compromising Quality

Refrigeration energy efficiency
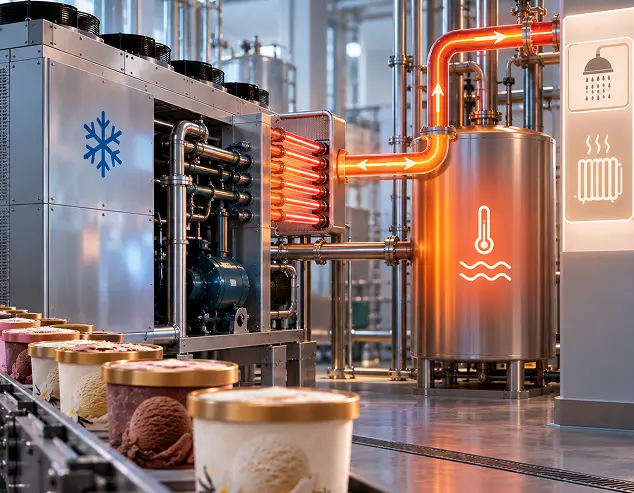
Reclaimed condenser heat is redirected to plant hot-water and space-heating loads.
8–12% savings
Compressor output matches real-time load instead of cycling at fixed capacity.
10–15% savings
Demand-based defrost cycles reduce unnecessary heat input into cold spaces.
3–5% savings
Higher-performance envelope insulation reduces continuous heat ingress.
4–7% savings
High-speed and better-sealed doors limit warm-air infiltration at transfer points.
2–4% savings
Ice or eutectic storage shifts compressor load to off-peak electricity periods.
5–9% savings
Ongoing controls tuning and setpoint optimization across the refrigeration plant.
3–6% savings
0–0%
Potential hardening-energy savings
through optimization

Refrigeration Performance You Can Measure

Client Profile

Large-scale ice cream producer, Saudi Arabia, 30,000 L/day production capacity.

Challenge

Long hardening times, high distribution losses and inconsistent quality complaints tied to temperature control.

Solution Implemented

Multi-zone hardening tunnel, ultra-low cold storage and upgraded distribution refrigeration installed as one integrated cold chain.

Read More
8 hrs → 35 min
Hardening time
28%
Energy reduction
12–15% → 3.5%
Distribution losses
85%
Fewer complaints

Client Profile

Premium export facility in the UAE.

Challenge

Temperature variation during export handling and distribution.

Solution Implemented

Integrated refrigeration and temperature-control improvements.

Read More
25% → <1%
Rejection
30%
Energy improvement

Client Profile

Retail chain operating across Qatar.

Challenge

Product waste caused by unstable retail freezer conditions.

Solution Implemented

Improved freezer control and temperature monitoring across the retail chain.

Read More
10% → 2.5%
Product waste
75%
Waste reduction

What Does Better Refrigeration Return to Your Business?

$0M 5-Year Benefit
0% 5-Year ROI
0 Years Payback
0% IRR
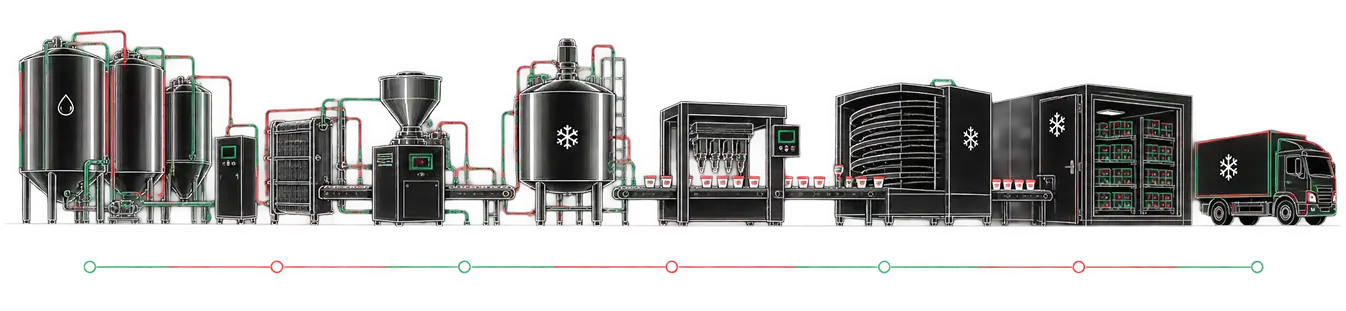
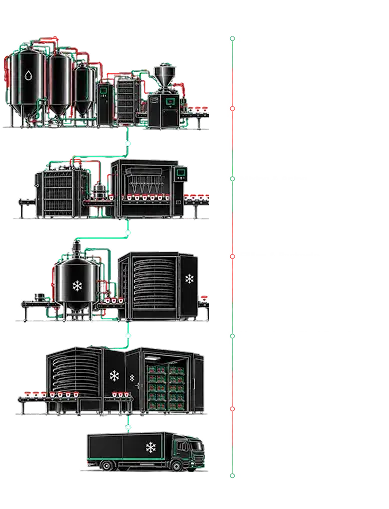
Ice cream cold chain process from raw milk storage to distribution
Energy Savings
32%
Yield Improvement
24%
Quality Premium
18%
Reduced Losses
16%
Labor Savings
10%
SYSTEM
INITIAL INVESTMENT
ANNUAL ADDED VALUE
PAYBACK
IRR
Continuous Freezer
$0.6M–$1.2M
$180K–$320K/yr
2.5–3.5 yrs
32–40%
Tunnel Hardening
$0.9M–$1.6M
$280K–$420K/yr
2.0–2.8 yrs
38–48%
Spiral Hardening
$0.85M–$1.5M
$260K–$400K/yr
2.1–3.0 yrs
36–46%
Ultra-Cold Storage
$0.7M–$1.4M
$200K–$350K/yr
2.4–3.6 yrs
30–42%
Distribution System
$0.4M–$0.9M
$150K–$260K/yr
2.0–3.2 yrs
34–44%
Brand Value Premium
Market Expansion
Risk Reduction
Customer Loyalty
Operational Efficiency
Sustainability Credentials
Retail Relationships
Future-Proof Compliance
Asset Value
Competitive Advantage

Daily Refrigeration Questions, Answered

Ice cream should be held at -25°C to -30°C for long-term cold storage. Retail display cabinets typically maintain -18°C to -22°C through point of sale.

Freezing begins the process of forming ice crystals while incorporating air into the mix. Hardening rapidly reduces the product temperature further to stabilize the ice crystal structure and achieve the required finished texture.

The cost depends on production capacity, tunnel size, target temperatures, refrigeration load, automation and installation requirements. A system assessment is typically required before providing an accurate project estimate.

Ice cream can become icy when temperature fluctuates during freezing, storage or distribution. Repeated warming and refreezing allows ice crystals to grow, which can negatively affect the product's texture.

Compliance requires controlled refrigeration conditions, documented monitoring procedures, appropriate records, corrective actions and a food-safety management system aligned with the applicable requirements of ISO 22000.

A temperature excursion can reduce the available safety margin and may affect product quality and shelf life. The appropriate response is to investigate the duration and cause of the excursion and follow the site's monitoring and corrective-action procedure.

Energy consumption can be reduced through efficient refrigeration equipment, optimized operating temperatures, proper insulation, reduced heat gain, efficient compressor operation and regular system maintenance.

Payback depends on the initial investment, production volume, refrigeration load, energy consumption, operating hours and achievable savings. A project-specific ROI calculation provides the most useful estimate.

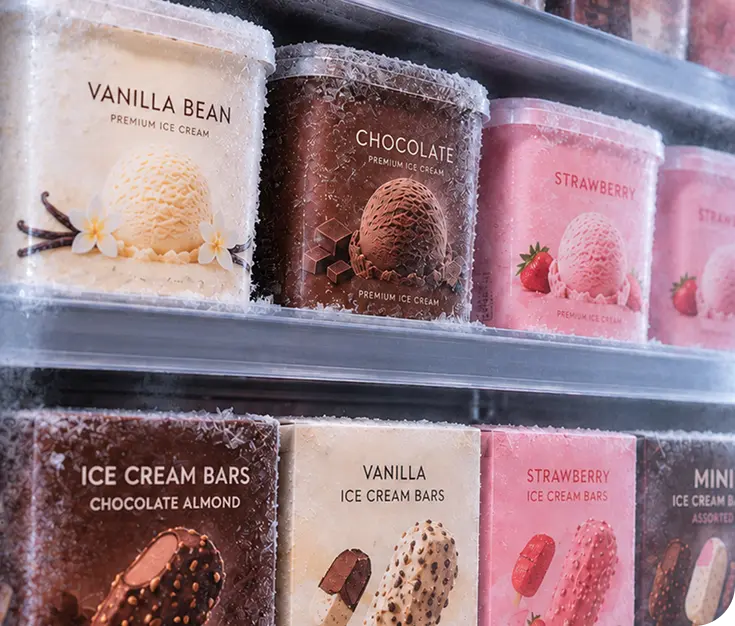
Premium ice cream products in cold storage

Let's Engineer a Better Cold Chain.

Tell us about your production capacity, products and refrigeration requirements. We'll help identify opportunities to improve quality, efficiency and operational performance.

Request a Quote

Tell us more about yourself and what you have got in mind.

Eco-Smart, Turnkey Cooling Solutions
for Tomorrow

We provide advanced commercial cooling solutions that reduce emissions and drive energy-efficient, sustainable performance.

Request a Quote

Tell us more about yourself and what
you have got in mind.